Lesson 2: Data Representation
 Effective data representation is the foundation for meaningful statistical analysis and the communication of insights derived from that analysis.
Components of a Dataset
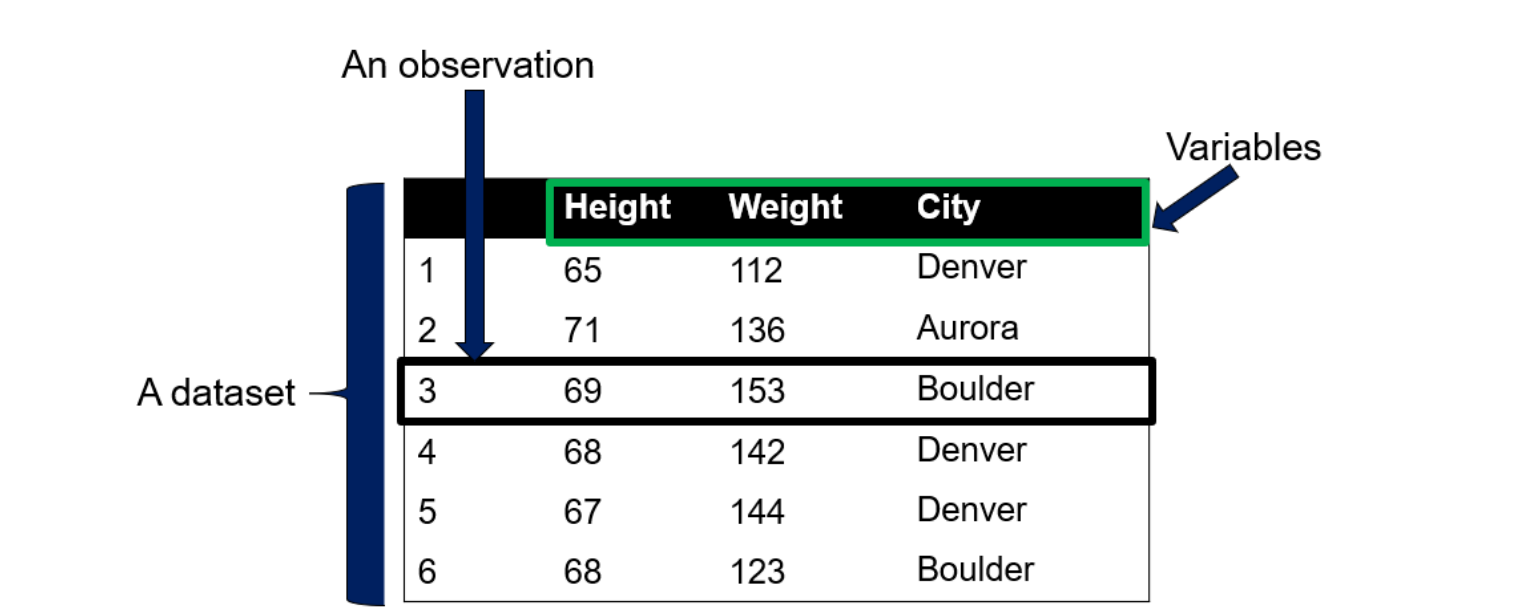
Dataset: A dataset is a collection of observations, where each observation consists of values associated with different variables. A dataset is typically represented as a table of rows and columns.
Variables:The column names in a dataset, such as height, weight, and city, are called variables. A variable is a characteristic or property of an individual, entity, or object that takes on different values.
Data: Data are values or facts associated with variables. The value of a variable describes a characteristic of an individual or object. If “71” is assigned to the height variable for a specific person, that value “71” describes how tall the individual is.
An Observational Unit: An observational unit is the individual or object whose data is to be observed, measured, or collected especially in a study.
An Observation: An observation is an individual’s data on various variables in the dataset. An observation is a row of values in a dataset. Other names for an observation include an instance, a data point, a tuple, a record, or an example. A dataset is, therefore, a collection of observations belonging to different observational units.
Types of Data
Data can be broadly divided into categorical and numerical data. Categorical data is qualitative data, while numerical data is quantitative data. It is very important to understand data types because the operations and transformations applied to data depend on the data type. Certain transformations are not suitable for certain types of data. For example, adding or subtracting categorical data does not make sense. The term “variable type” refers to “data type” because a variable type is determined by the type of data assigned to the variable. A categorical variable will take on categorical data, while a numerical variable will take on numerical data.
Categorical Data
Categorical data are identifiers, names, or labels that describe an individual or object. For example, “male” and “female” are categorical data belonging to the variable “gender”. Categorical data can be further divided into nominal and ordinal data.
Nominal Data
Nominal data are labels that identify the category or group to which an individual or object belongs. For example, “yes” or “no” data is nominal. Data collected on variables such as ethnicity, eye color, city, State, country, etc., is nominal.
Ordinal Data
Ordinal data is nominal data where the labels or categories can be meaningfully ordered or ranked. For example, the quality of food in a restaurant can be rated using ordinal data such as “very poor,” “poor,” “fair,” “good,” or “excellent.” Ordinal data provides information about the relative position of an individual or object. Data about the educational levels of individuals, such as “high school diploma,” “associate degree,” “bachelor’s degree,” “master’s degree,” or “doctoral degree,” is ordinal data. Though numbers could be used to represent different categories in ordinal data, the numbers only represent ranks.
The difference or interval between two ordinal data points does not make sense, as the conceptual difference between rank 1 and rank 2 is not necessarily the same as the conceptual difference between rank 2 and rank 3. This is why some statisticians argue that data on a Likert scale is ordinal and should not be used as numerical data. However, others think it is possible to calibrate a Likert scale so that the intervals between successive values correspond to the same conceptual difference. This argument has been on for years and is not going away. An example of data on a Likert scale includes “strongly disagree,” “disagree,” “undecided,” “agree,” and “strongly agree.” If you choose to use data on a Likert scale as numerical data, you should have a good rationale. Otherwise, such data should be treated as ordinal data.
Numerical Data
Numerical data are numbers that can be mathematically or statistically processed to generate meaningful results. For example, numerical data can be added, subtracted, averaged, etc. Although categorical data can be transformed or coded into numbers, such numbers only represent categories and cannot be mathematically or statistically processed into meaningful results. For example, categorical values such as “male” and “female” belonging to a categorical variable, gender, can be coded respectively as “0” and “1”. However, the “0” and “1” cannot be averaged, added, or subtracted to produce meaningful results. So, categorical data transformed into numbers should not be treated as numerical data. Numerical data can be classified into interval and ratio data.
Interval Data
Interval data is numerical data associated with a variable that does not have a meaningful, natural, or absolute zero. A variable has a meaningful zero if its zero value represents the absence of the quantity that the variable captures. For example, temperature can be used to measure or capture how hot an individual or object is. A temperature of zero degrees Celsius does not mean the absence of heat. Similarly, the math score of zero does not mean the absence of math ability. So, temperature and math score data are interval data because temperature and math score variables have an arbitrary zero point.
It is not meaningful to use multiplication and division to process interval data. If student A scores 100% on a math test and student B scores 50%, we cannot say that student A is twice as smart as student B because a math score of 0% does not represent the absence of math ability. However, interval data can be subtracted and added. The difference between two interval data points on the same variable is meaningful. For example, the difference or interval between the math scores of students A and B is 50 points. So, we can say that the math score of student A is 50 points higher than the math score of student B. Also, equal intervals on the interval scale represent the same concept or conceptual difference. For example, the interval between 20 and 30 and between 80 and 90 on a temperature scale in degrees Celsius represent the same temperature difference.
Ratio Data
Ratio data is numerical data associated with a variable that has a meaningful zero. That is, ratio data is data on a scale that has a meaningful zero point. Ratio data has all the properties of interval data. However, variables with ratio data have a meaningful zero point, while variables with interval data have an arbitrary zero point. An example of ratio data is data collected on the number of cell phones an individual owns. “Zero” number of phones means “no phone” or “the absence of a phone.” Therefore, the data associated with the number of cell phones is ratio data. Another example of ratio data is height data. Multiplication, division, addition, subtraction, and other mathematical operations can be used to process ratio data. If store A sold 20 phones yesterday and store B sold 10 phones yesterday, then we can say that store A sold twice the number of phones sold by store B. In other words, store B sold half the number of phones sold by store A. We could also say that store A sold 10 more phones than store B. Note that the variable in this example is the number of phones sold. In conclusion, the data types determine the type of data analysis that can be performed with the data.